Cases of Disaster
Sediment Movement Trace
(Hougawachi Atsumari Area, Minamata City, Kumamoto Prefecture)
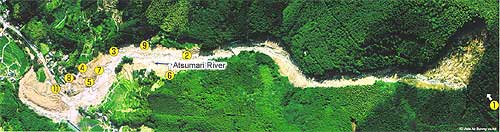 Source: Asia Air Survey Co., Ltd.
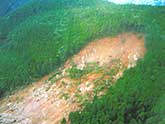
(1)Collapse at the source head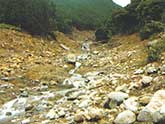
(2)Falling trace of debris flow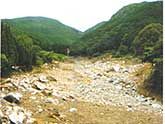
(3)Debris flow sediments distributed all over the valley bottom.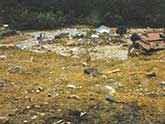
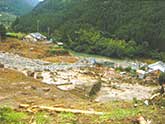
(4)A debris flow ran on a terrace and fell.
(5)Sediment at the confluence of Atsumari River and Hougawachi River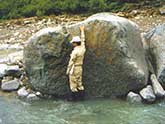
(6)A large boulder transported by a debris flow
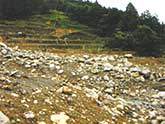
(7)Debris flow sediments in tongue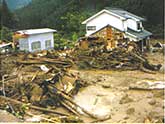
(8)A great deal of driftwood going down with a debris flow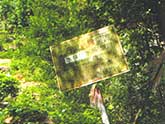
(9)Warning sign of debris flow hazard torrents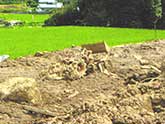
(10)A farm vehicle caught in a debris flow
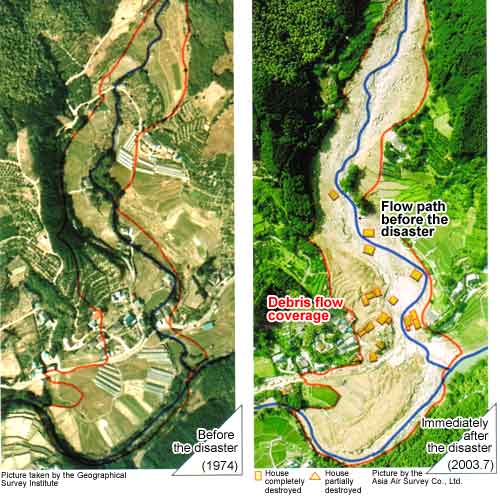
Hougawachi Atsumari Area, Minamata City, Kumamoto Prefecture
(Pictures compared before and after the disaster)
Dameges such as sediment-related disasters
| Disaster occurred | Prefecture | Occurrence number | Human damage | Number of destroyed houses | |||
|---|---|---|---|---|---|---|---|
| Death | Injury | Complete destruction | Half destruction | Partial destruction | |||
| Debris flow | Fukuoka Prefecture | 5 | 1 | 6 | 14 | 22 | |
| Kumamoto Prefecture | 3 | 19 | 7 | 15 | 1 | 5 | |
| Kagoshima Prefecture | 2 | ||||||
| Slope failure | Fukuoka Prefecture | 39 | 1 | 1 | 7 | 13 | |
| Saga Prefecture | 1 | ||||||
| Nagasaki Prefecture | 5 | 2 | 1 | ||||
| Kumamoto Prefecture | 1 | 1 | |||||
| Kagoshima Prefecture | 1 | 2 | 1 | ||||
| Total | 57 | 22 | 8 | 25 | 22 | 42 | |